
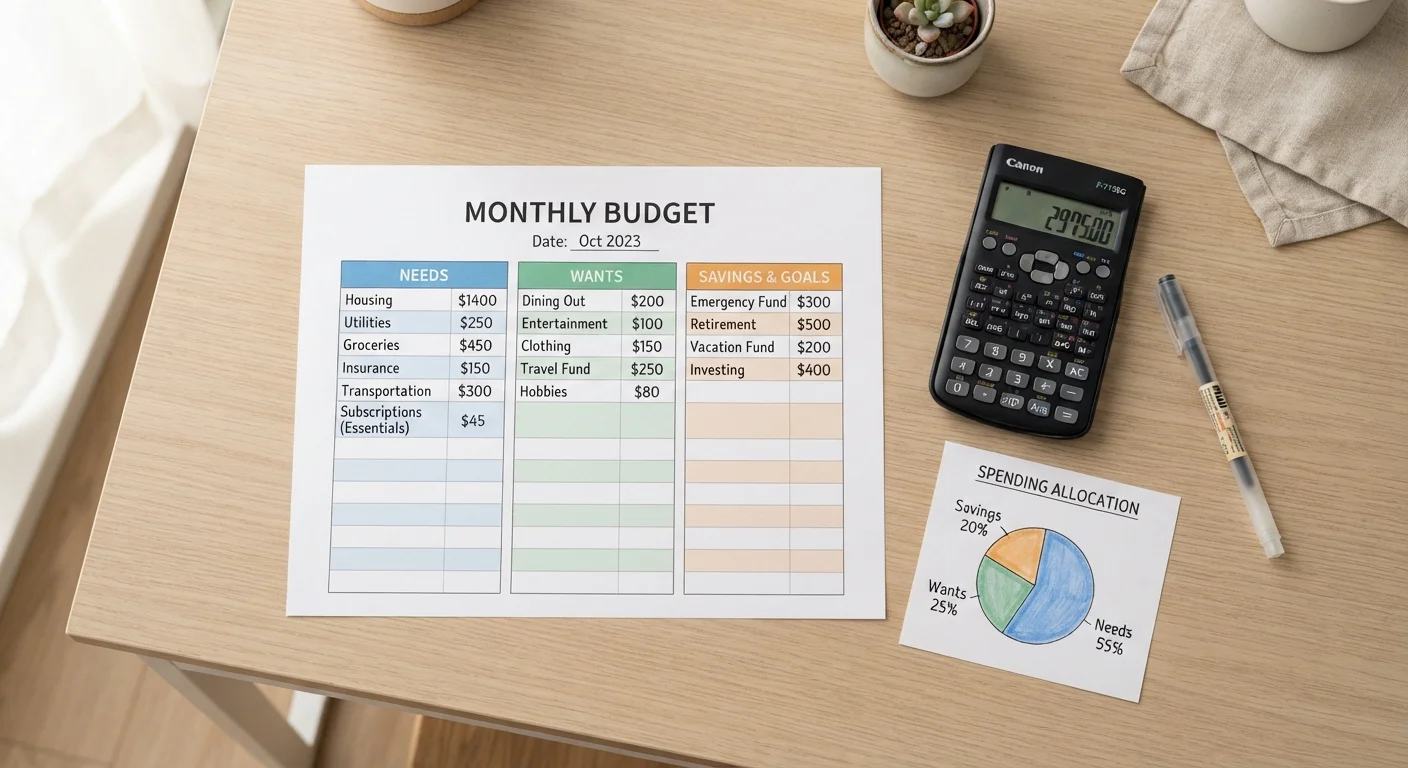
How the Three Categories Break Down
The framework splits every dollar of take-home pay into three buckets. Understanding what belongs in each bucket is the first practical step - and where most people run into confusion.
Needs (50%): These are non-negotiable expenses required to live and work. Rent or mortgage, utilities, groceries, health insurance, minimum loan payments, and basic transportation all fall here. The defining test is whether eliminating the expense would cause genuine hardship. For a deeper look at how this category works, see the needs vs. wants vs. savings framework.
Wants (30%): Discretionary spending that improves quality of life but isn't strictly essential - streaming services, restaurants, hobbies, gym memberships, and travel. This category is intentional: it preserves space for enjoyment so the budget doesn't feel punishing.
Savings and Debt Repayment (20%): This bucket covers retirement contributions, emergency fund building, and any debt payments beyond the required minimum. Financial professionals generally suggest prioritizing high-interest debt and a three-to-six-month emergency fund before focusing on other savings goals.
33%
Average share of income spent on housing
The U.S. Bureau of Labor Statistics Consumer Expenditure Survey consistently finds housing consumes roughly a third of average household spending, often exceeding the 50/30/20 rule's implied ceiling.
$1,700
Median monthly student loan payment
Federal Reserve data suggests borrowers with student loan debt carry payments that can significantly strain the needs and savings categories simultaneously.
57%
Americans living paycheck to paycheck
Various consumer surveys in recent years have found a majority of U.S. adults report little or no monthly budget surplus, highlighting the challenge of reaching a 20% savings rate.
Where the Formula Gets Complicated
The 50/30/20 rule earns its popularity through simplicity, but real household budgets are rarely that tidy. Several structural realities in the U.S. economy can strain the framework.
Housing costs: In many metropolitan areas, rent or mortgage alone can consume 35-45% of net income for middle-income earners. When housing eats most of the 50% allocation, other needs - groceries, transportation, insurance - become difficult to fit without overrunning the limit.
Variable income: Freelancers, gig workers, and commission-based employees face month-to-month income swings that make fixed percentage targets difficult to hit consistently. A floor-based approach - covering needs first, then allocating surpluses - often works better.
Student loan debt: For borrowers carrying significant student loan balances, classifying minimum payments as a "need" and extra payments as part of the 20% creates a structural tension. Depending on total debt load, the 20% savings bucket may feel inadequate from the start.
Start With What You Actually Spend
Before applying any percentage target, pull three months of bank and credit card statements and categorize your real spending. Most people discover their actual needs exceed 50% or their wants are higher than expected. Starting from reality - not the ideal - makes the framework far more useful from day one.
The rule is best understood as a directional guide rather than a strict formula. Households with higher housing costs might reasonably run a 60/20/20 or 55/25/20 split while they work toward a different balance.
Applying the Rule to a Real Household
To see how the math works in practice, consider a household with a combined monthly net income of $5,000.
- Needs (50% = $2,500): Rent $1,400, utilities $150, groceries $400, health insurance premiums $300, car insurance and gas $250. Total: $2,500.
- Wants (30% = $1,500): Dining out $300, streaming and entertainment $100, clothing $200, gym $50, travel savings $300, personal spending $550.
- Savings/Debt (20% = $1,000): 401(k) contribution $400, emergency fund $300, extra credit card payment $300.
This example works cleanly at $5,000 net, but add $200 more in rent or a car payment and the needs category overflows. That's when deliberate adjustments - trimming wants, consolidating debt - become necessary rather than optional.
For households ready to go beyond the basics, a monthly budget reset routine can help you track whether your actual spending is drifting away from your targets.
How It Compares to Other Approaches
The 50/30/20 rule is one of several percentage-based methods, each with distinct trade-offs. Zero-based budgeting assigns every dollar a specific job each month, offering more control but requiring more active management. The pay-yourself-first method automates savings before allocating anything else, which suits people who struggle to save consistently but don't need detailed spending oversight.
The 50/30/20 rule sits in the middle: more structured than no plan at all, less demanding than zero-based tracking. Comparing zero-based and percentage-based approaches can help clarify which fits your habits and income type.
“A budget is telling your money where to go instead of wondering where it went. Any system that keeps you honest about that - even an imperfect one - is better than no system at all.”
— Dave Ramsey, Personal finance author and radio host
Ultimately, the method you'll actually maintain is more valuable than the theoretically optimal one. The 50/30/20 rule's main advantage is its low barrier to entry - it gives people a workable structure on day one without requiring spreadsheets or budgeting software.
For a broader side-by-side look at popular frameworks, the habits that make budgets last article explores the principles that help any system stick long-term.
This article is for general informational and educational purposes only and does not constitute personalized financial or investment advice. Consult a licensed financial adviser before making decisions based on your individual circumstances.