The Specs That Drive Picture Quality
Most TV spec sheets list a dozen or more figures, but a handful genuinely determine what you see on screen every day. Knowing which numbers carry real weight - and which are marketing padding - changes how confidently you can evaluate a display.
| Meaningful resolution threshold | 4K visible at typical living-room distances on 55"+ screens (General industry viewing-distance guidance) |
| Practical native refresh rate options | 60Hz or 120Hz (consumer panels) (Panel hardware specifications) |
| HDR brightness minimum (HDR10) | 1,000 nits peak for full HDR effect (HDR10 specification standard) |
| Main HDR formats to check | HDR10, Dolby Vision, HDR10+ (Industry format standards) |
| Local dimming types | Edge-lit, full-array, or OLED (per-pixel) (Panel technology classifications) |
| Sound spec reliability | Wattage figures alone do not predict audio quality (Consumer electronics industry consensus) |
Resolution is the most advertised spec, and it does matter - but only up to a point. At typical living-room viewing distances, the jump from 1080p (Full HD) to 4K is visible on screens 55 inches and larger. At closer distances, it becomes apparent sooner. The case for 8K is far harder to make: native 8K content is extremely scarce, and most viewers cannot distinguish 8K from 4K at any practical seating distance. For a thorough breakdown, see our guide to HD, 4K, and 8K in plain English.
Peak brightness (nits) is often undervalued. A TV rated at 600 nits will wash out in a sunlit room; one reaching 1,000-1,500 nits renders HDR highlights as the format intends. If your viewing area gets significant daylight, this number deserves close attention - more on that in our guide to managing glare and contrast in bright rooms.
HDR format governs how the TV interprets high-dynamic-range signals. HDR10 is the universal baseline. Dolby Vision adds dynamic metadata that adjusts the image scene by scene, generally producing more precise results. HDR10+ does the same but is used primarily on a different set of devices. A TV that only lists "HDR" without specifying a format may support only the baseline tier.
The Specs That Are Routinely Misrepresented
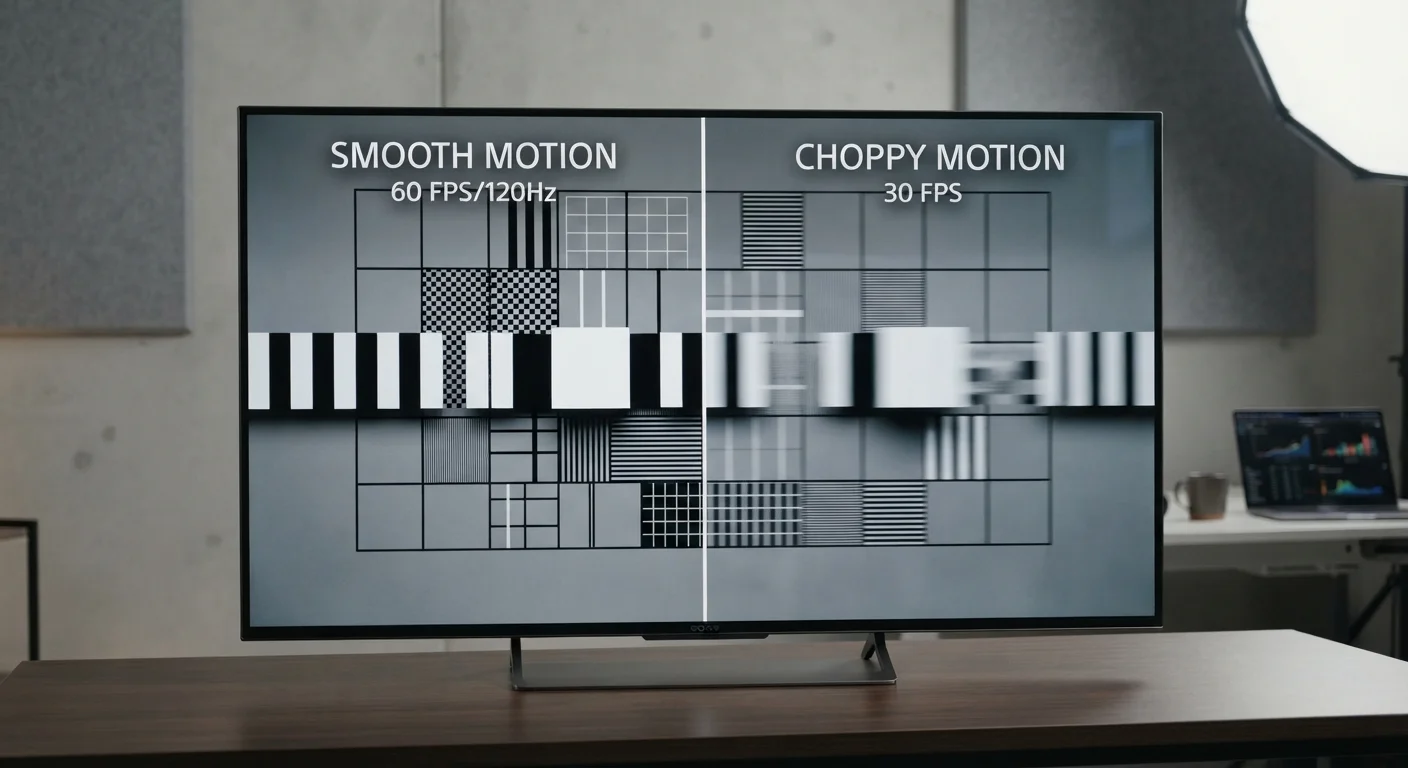
Refresh rate is where spec-sheet confusion peaks. Manufacturers advertise figures like 120Hz, 240Hz, or even higher - but many of those numbers describe a processed or interpolated rate, not what the panel physically does. The native refresh rate - either 60Hz or 120Hz on consumer TVs - is the number that matters. A native 120Hz panel moves frames more smoothly for sports and fast gaming; a 60Hz panel running motion-smoothing algorithms is not the same thing. For a full explanation of the gap between advertised and native rates, see our refresh rate reality check.
Native refresh rate
The number of times per second a TV panel physically redraws the image, measured in Hz. 60Hz and 120Hz are the two real options on consumer TVs; higher numbers in advertising typically reflect processed or interpolated rates.
Peak brightness (nits)
A measure of how much light a TV can output at its brightest point, expressed in nits. Higher peak brightness allows HDR content to render specular highlights correctly and makes the image more visible in well-lit rooms.
Local dimming zones
Independently controlled backlight segments that allow an LCD TV to dim dark areas of an image while keeping bright areas lit. More zones generally produce sharper contrast with less blooming.
HDR (High Dynamic Range)
A display standard that expands the range between the darkest and brightest parts of an image. HDR10, Dolby Vision, and HDR10+ are the main formats, each using different metadata approaches to optimize the image.
Response time
The speed at which a pixel can transition between states, measured in milliseconds. Lower response times reduce motion blur and ghosting, making this spec relevant primarily for gaming use.
Color volume
A measure of how many colors a TV can display across a range of brightness levels. Expressed as a percentage of a reference color space such as DCI-P3 or BT.2020, though the choice of reference standard affects comparisons.
Local dimming zones control how precisely a TV dims its backlight behind dark areas of an image. A TV listing "local dimming" without specifying zone count may use only a handful of zones across the entire panel, producing visible blooming around bright objects on dark backgrounds. Full-array local dimming with a high zone count - or, alternatively, an OLED panel where each pixel dims independently - delivers much cleaner contrast. This detail is frequently skipped by first-time buyers but shapes everyday picture quality significantly.
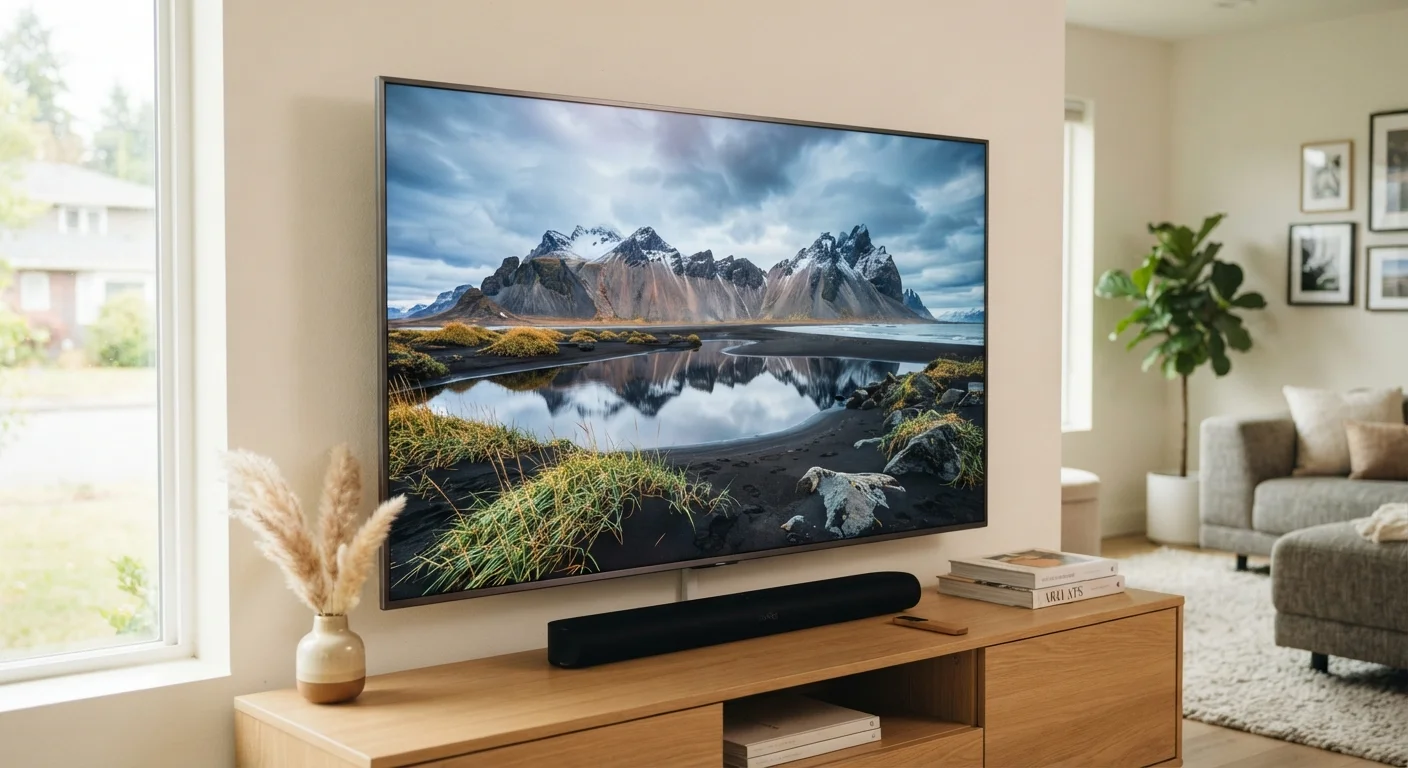
Sound output (watts RMS) is easy to dismiss because it looks like a simple power figure. In practice, the wattage spec tells you almost nothing about actual audio quality - speaker driver design, cabinet tuning, and equalization software matter more. Treat built-in audio specs skeptically; most flat panels benefit from an external soundbar regardless of what the spec sheet claims.
Motion Smoothing Is Enabled by Default
Most TVs ship with motion interpolation - sometimes called the soap opera effect - turned on. This processing can make film content look unnatural regardless of the panel's native refresh rate. It can usually be disabled in the picture settings menu. Our article on why new TVs look unnatural and how to fix it explains the adjustment process.
How to Read a Spec Sheet Without Being Misled
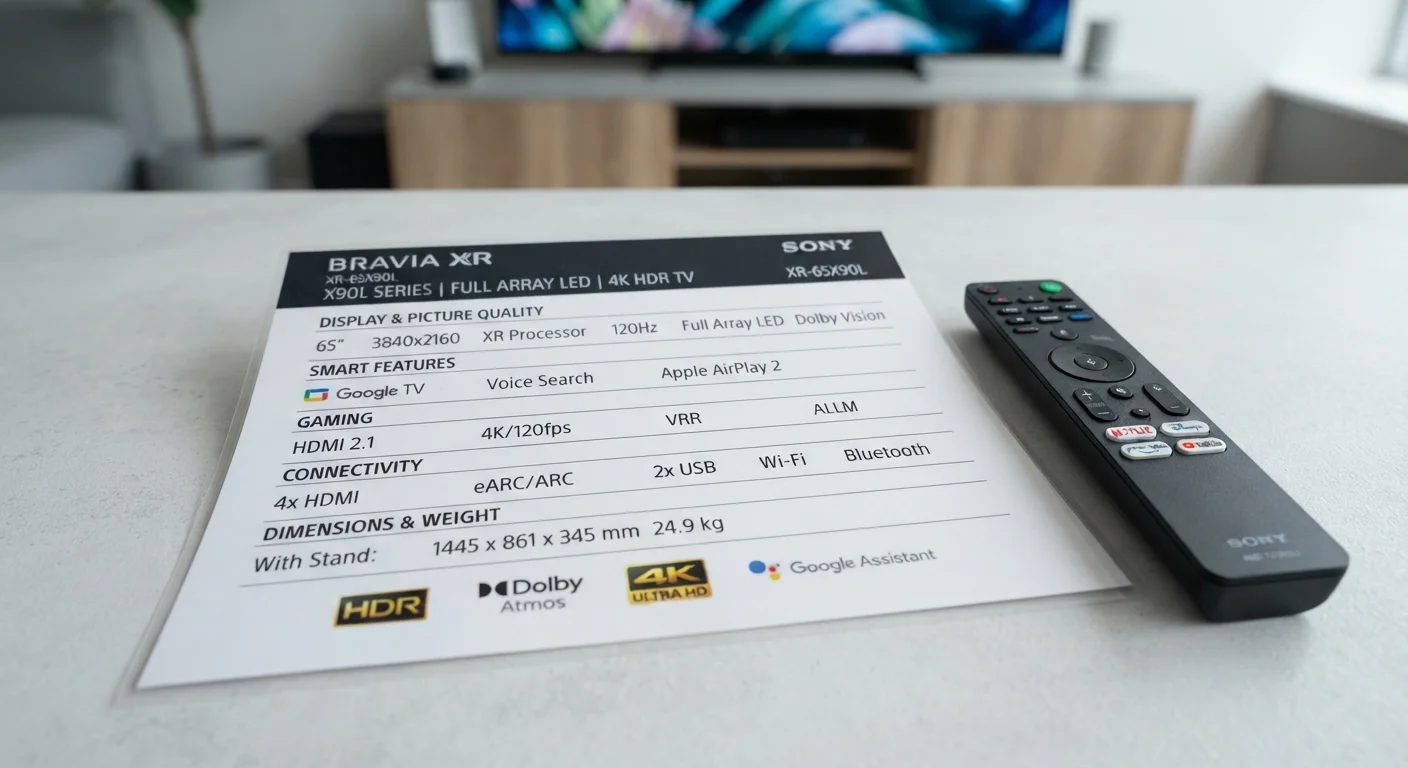
Spec sheets report what manufacturers choose to disclose, in the most favorable framing available. Brightness figures may reflect peak output for a fraction of the screen area, not sustained full-panel luminance. Color volume percentages can be cited using different reference color spaces, making direct comparisons unreliable without knowing which standard was used.
Panel technology - OLED versus QLED versus traditional LCD - underpins almost every other picture quality spec. Understanding the fundamental differences between these technologies explains why two TVs with similar spec numbers can look dramatically different in practice. Our OLED vs. QLED explainer covers this in depth.
For specs that manufacturers routinely leave out entirely - input lag measured in milliseconds, actual local dimming zone counts, or the smart platform's update policy - third-party lab reviews and comparison databases are more reliable sources than the box or the product listing. Our overview of what spec sheets leave out and how to fill the gaps walks through where to find that missing information.
Finally, match the screen size to your actual room geometry before any other decision. Viewing distance and room dimensions determine how much resolution and screen size you actually need - and how much you'd be paying for specs that your seating position makes invisible. Our screen size vs. viewing distance guide gives a practical framework for working this out.